A wide range of tests can play a role during the diagnostic process of patients with neurodegenerative symptoms. The pathway usually starts with neuropsychological examinations. If caught early, the initial diagnosis will be Mild Cognitive Impairment (MCI). Additional invasive and non-invasive tests can help to further pinpoint the underlying disease, which can be Alzheimer’s disease (AD), but also other types of dementia related conditions, such as vascular dementia or frontotemporal lobe dementia. Non-invasive diagnostic methods may include brain MRIs, which are, after acquisition, analyzed by a radiologist, usually through visual assessment.
Why is this visual assessment not an unambiguous task? What are the challenges? What can quantitative analyses offer to make it more straightforward and how can AI enable a smooth implementation of this approach?
The key features to assess on an Alzheimer MRIs
Alzheimer’s is a complex neurodegenerative disease which involves atrophy of various brain structures. Most important are the hippocampus, the entorhinal cortex and the perirhinal cortex. Additionally, atrophy of the temporoparietal lobe should be assessed and AD is often accompanied by pathological vascular components. A structural MRI visualizes the complete brain and is relatively sensitive to any changes in brain volume. Therefore it provides a suitable method to map the current stage of a patient’s brain and possibly, through follow up exams, any changes over time.1 It can take about 20 months (European average) to get to a firm diagnosis, due to the low prediction accuracy (60-80%) of current neurological assessments overall, including MRI.2
Visual assessment of Alzheimer MRIs and why this is not a straightforward task
Currently, visual assessment is the primary method of diagnosing AD based on a brain MRI. This method basically comes down to looking at the scan, assessing all the elements mentioned in the previous paragraph, while comparing it to all the brain MRIs the radiologist saw before. The visual assessment therefore heavily relies on the experience of the radiologist and his/her frame of reference. Hence, it is not surprising that a survey conducted by the ESNR showed that almost a third of the interviewed neuroradiologists are not entirely confident using visual rating scales.3 To provide support, leading international experts developed semi-quantitative scales which are recommended globally to use for MRI-based dementia diagnosis.4,5
Using semi-quantitative scales
Various visual rating scales for the assessment of neurodegenerative diseases are available, for example, the Global Cortical Atrophy Score (GCA), Koedam Score for parietal atrophy, Medial Temporal Lobe Atrophy (MTA) score and the Fazekas score for the assessment of white matter hyperintensities. These scales are called semi-quantitative for a reason: they do provide a quantified score, but assessment is still very much qualitative. Example questions to get to a score may include are the vesicles widened? Is there moderate loss of hippocampal volume? Do you see opening of the sulci? All valuable handles for assessment, but by no means quantitative in a way that they provide clear lengths that could be measured with a ruler.
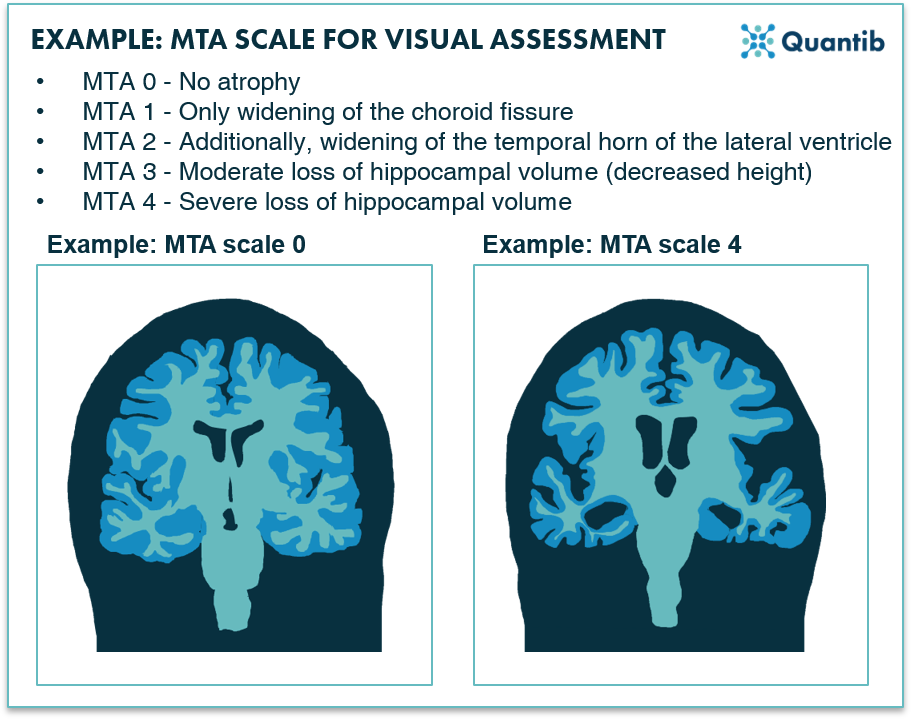 Figure 1: An example of a visual scale used for Alzheimer MRI assessment: the MTA scale for the scoring of medial temporal lobe atrophy.1
The importance of experience
Without normative context, it is hard to define sulci as substantially widened or the height of the hippocampal horn as abnormally decreased. This is where experience becomes extremely important. Neuroradiologists train years by looking at many scans to get a frame of reference. This does not only mean that that their mental database is highly dependent on the scans they have seen during those years, it also means that neuroradiologists with less experience have a smaller stack of images in the back of their mind to leverage as context during assessments.
The overall conclusion relies significantly on the experience of the radiologist that evaluated the scan. With each radiologist performing on a different level of expertise, this can create inconsistencies in reporting, not only during initial assessments, but especially when performing a longitudinal analysis. As it is not uncommon that two different radiologists will assess the two timepoints, this may very well lead to interobserver variance. In other words, the report could do with some more consistency.
The difficulty with age
Another complicating factor is age. What is normal and what is not depends heavily on the age of the patient. Certain levels of atrophy are normal when aging, but when does this become abnormal? Hence, it is of utmost importance to constantly keep the age of the patient in mind, while assessing the exam. Not impossible to do, but it would of course be easier to have as tool to provide support on this aspect.
Too small to detect with the naked eye
In Alzheimer’s disease, the volume of the brain may show very subtle decline over time. Every radiologist will confirm that the smaller the changes, the harder it is to detect these with the naked eye. Hence, differentiating a healthy brain from a diseased one can be a challenging task if the disease progresses slowly.
Quantitative analysis of Alzheimer MRIs using AI
Quantitative imaging in neuroradiology is becoming increasingly important for the assessment of various neurological implications. Over the past years research has led to many algorithms that can provide quantitative measurements to support diagnosis. Artificial intelligence vendors took this one step further and offer certified algorithms that provide the radiologist with the tools to detect and assess disease related biomarkers, which can even lead to a reduced workload.
But how do we extract quantifiable features from brain MRIs? Bring in, AI. We will discuss a couple of benefits of AI implementation in the dementia diagnosis process below.
Benefit 1: Leverage AI second opinion
Medical images are increasingly part of the diagnosis process of many diseases, leading to an increase in data acquired. These scans can be leveraged beyond the initial diagnosis of a patient, by deploying them for algorithm training and validation. These algorithms can be trained on more scans than a radiologist can assess in a lifetime. Algorithms are designed to perform a specific task which makes them robust and often provide a better reproducibility rate than radiologists. As a result, diagnostic accuracy can be improved significantly when visual assessments are supported by AI.6 Since the AI algorithm will run in the background, a neuroradiologist can always count on the AI to provide additional information as a form of a second opinion, which may bolster the confidence of the reading radiologist.
Benefit 2: Provide context with population-based normative curves
Differentiating between normal and abnormal atrophy (development) can be made significantly easier by providing an objective reference database that shows how the brain volume of the patient compares to a larger population. A useful way to present this is by making use of normative curves: a graph showing the distribution of brain volumes per age (see figure 2 for an example).
Benefit 3: Easy insights in different disease patterns
If the AI software also determines volumes per brain structure, this can provide useful support for recognizing different atrophy patterns related to different diseases. For example, AD usually shows hippocampal and medial temporal lobe atrophy, where frontotemporal lobe dementia is (can you guess?) characterized by accelerated decline of the frontotemporal lobe volume.1,7 Software that shows the atrophy in the different lobes can easily provide the information which lobe is showing relatively more atrophy than other lobes.
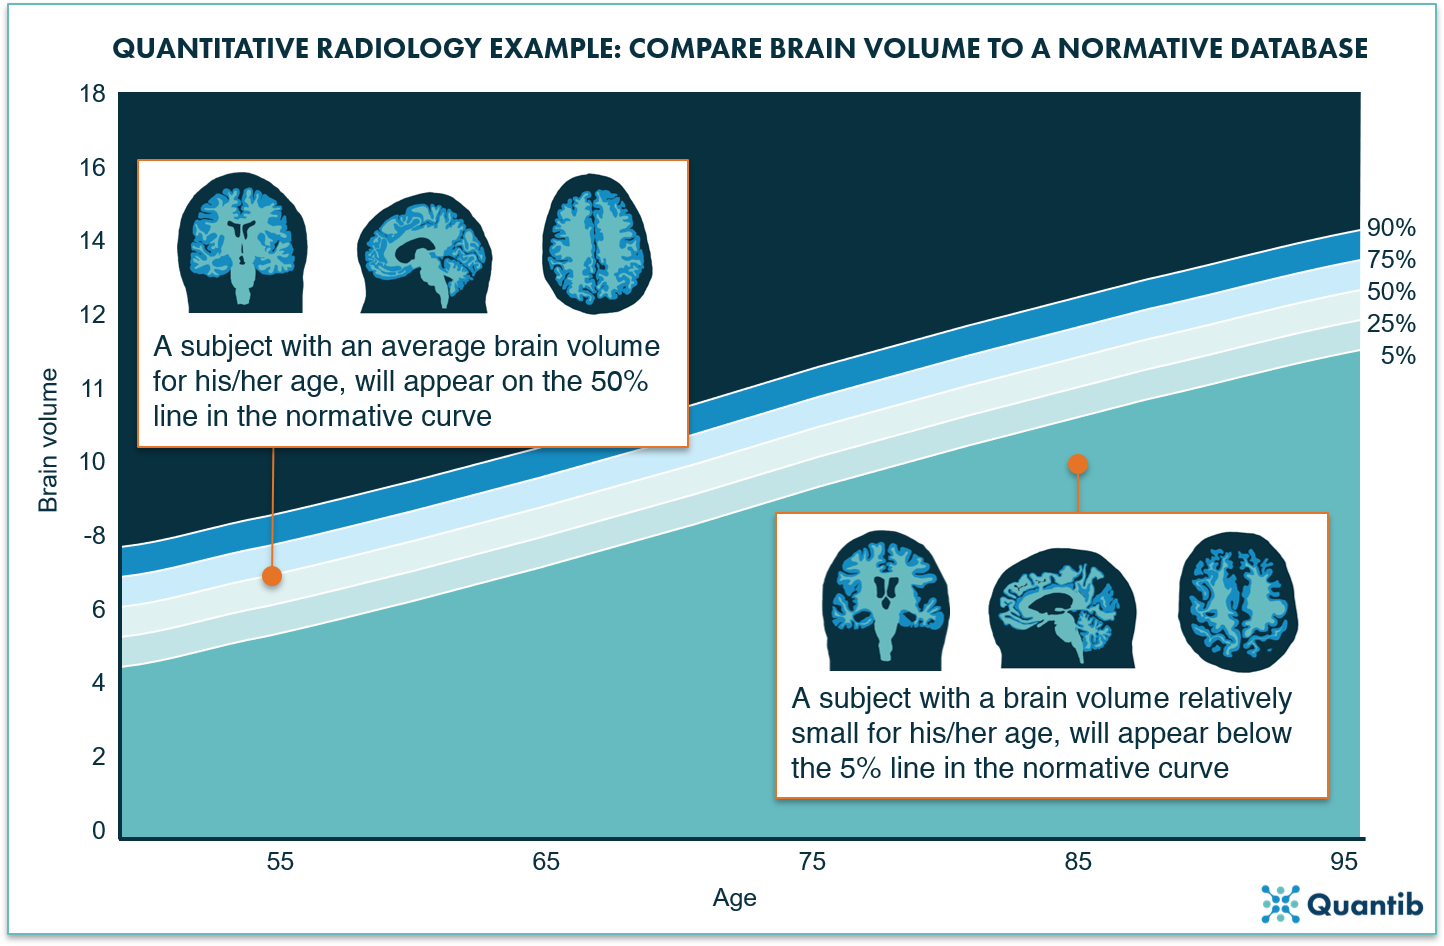 Figure 2: The normative curves project a bandwidth for the normal loss of volume over time due to aging. When a brain structure is plotted on this curve, it will immediately provide insight on how likely it is that a patient’s brain volume is abnormal.
Benefit 4: Advance multidisciplinary team meeting contributions
It is often overlooked that quantitative imaging can advance diagnostic evaluation of multidisciplinary team meetings. Quantitative imaging can provide all professionals present at the MDT with a standardized and structured report containing objective results and normative curves. Just a couple of graphs can visually support the findings of the radiologist, explain those brief and clear to the other physicians and enable fast decision making.
Benefit 5: Improve communication with the patient
At the end of the day, the most important person to benefit from is the patient of course. Despite many improvements in the diagnostic process, the patient and its relatives often find it hard to understand the disease and its presentation. Patients usually want to understand as much as possible and often want to see the MRIs made of their own brain. However, understanding the story these images tell, is often a challenge. AI can provide simple, clear graphs explaining to the patient how his or her brain deviates from that of a healthy brain and therefore provide handles for understanding.
In conclusion
Current clinical practice of MRI-based AD diagnosis usually involves visual assessment supported with semi-quantitative scales. This can be difficult for the radiologist as it heavily relies on the experience. Additionally, it is patient-age dependent and changes can be very small making it hard to detect them with the naked eye. AI-powered quantitative assessment of brain MRI scans can offer several benefits including the improvement of diagnostic accuracy with the comparison to a reference population, enhanced MDT communications, and most importantly, provide the patient with more insight in his or her disease.

Bilbliography
- Frederik Barkhof, Marieke Hazewinkel, M. B. and R. S. Dementia - Role of MRI. 2012 Available at: https://radiologyassistant.nl/neuroradiology/dementia/role-of-mri. (Accessed: 7th December 2020)
- Mattila, J. et al. Optimizing the Diagnosis of Early Alzheimer’ s Disease in Mild Cognitive Impairment Subjects. J. Alzheimer’s Dis. 32, 969–979 (2012).
- Vernooij, M. W. et al. Dementia imaging in clinical practice: a European-wide survey of 193 centres and conclusions by the ESNR working group. Neuroradiology 61, 633–642 (2019).
- Frank, R., Frackowiak, R., Jack, C. & Jagust, W. J. The Use of MRI and PET for Clinical Diagnosis of Dementia and Investigation of Cognitive Impairment: A Consensus Report.
- American College of Radiology ACR Appropriateness Criteria® Dementia. (2019).
- Vernooij, M. W. et al. Automatic normative quantification of brain tissue volume to support the diagnosis of dementia: A clinical evaluation of diagnostic accuracy. NeuroImage Clin. 20, 374–379 (2018).
- Ledig, C., Schuh, A., Guerrero, R., Heckemann, R. A. & Rueckert, D. Structural brain imaging in Alzheimer’ s disease and mild cognitive impairment: biomarker analysis and shared morphometry database. Nat. - Sci. Reports 8, 1–16 (2018).