Over the past few years, imaging genetics has been a hot topic in brain research. Extracting large amounts of quantified information from medical images is a field of interest for many researchers engaged in medical image analysis. Imaging genetics focuses on the specific task of linking imaging phenotypes with genotypes, gene expression patterns and other “omics” data. In other words, developing algorithms that are able to provide genetic information based on medical images alone.
Gennady Roshchupkin investigated the application of imaging genetics to MRI brain scans. Linking local gene expression in the brain to MRI images can give insight to which alleles of Alzheimer’s disease (AD) related genes influence very specific parts in the brain. Insights that can aid future functional studies.
Roshchupkin’s approach combined the specific technique of voxel-based morphometry with gene expression profiles post-mortem obtained from 6 brains in Allen Brain Institute. We will explain the process in this blog post.
Voxel-based morphometry: imaging genetics applied
To deploy MRI to compare brain tissue at the smallest possible level, the voxel level, one can apply voxel-based morphometry (VBM). VBM performs a voxel-wise comparison of multiple MRI images to compare local tissue concentration.1 But how does VBM work? We will explain the technique in 4 steps using Roshchupkin’s research as an example.
Step 1: Registration for brain MRI scans
Before being able to do anything, you need a sufficient amount of the right data. Roshchupkin used 4071 MRI brain scans from non-demented individuals included in the Rotterdam Scan Study.
To compare these MRI scans in an “apples to apples” way, every brain scan needs to be registered to a brain template. Such a template shows an average of a set of brain scans, creating a map of the brain that can function as a baseline for further research. Roshchupkin used the template from the Montreal Neurological Institute (MNI) for registration. This operation will align all scans and allow for voxel-by-voxel comparison.
Step 2: Segmentation for MRI brain scans
All images in the registered dataset need to be segmented into different brain tissues to ensure comparison of the right tissue types (i.e. gray matter with gray matter, white matter with white matter, etc.). Roshchupkin applied a k-nearest-neighbors algorithm and segmented supratentorial white matter, gray matter, and cerebrospinal fluid.
Step 3: Smoothing of MRI brain scans
To really grasp the bigger picture and avoid a very noisy end result, all voxels in every image need to contain information about their neighbor. Roshchupkin applied a smoothing algorithm which replaces the value of each voxel with a (weighted) average value of all its neighbors.
Step 4: Cluster calculation in MRI brain scans
As a last step, Roshchupkin calculated clusters of voxels in grey matter. To obtain clusters, first, a linear regression analysis was performed to determine for each voxel a value (the p-value) that represents the strength of the relationship between grey matter (GM) density and the AD variant. Clusters are then formed based on these p-values by setting a threshold and simply checking which voxels are above and which are below this threshold. As the clusters are defined using AD variant information, they are likely to be correlated with gene expression of AD associated genes.
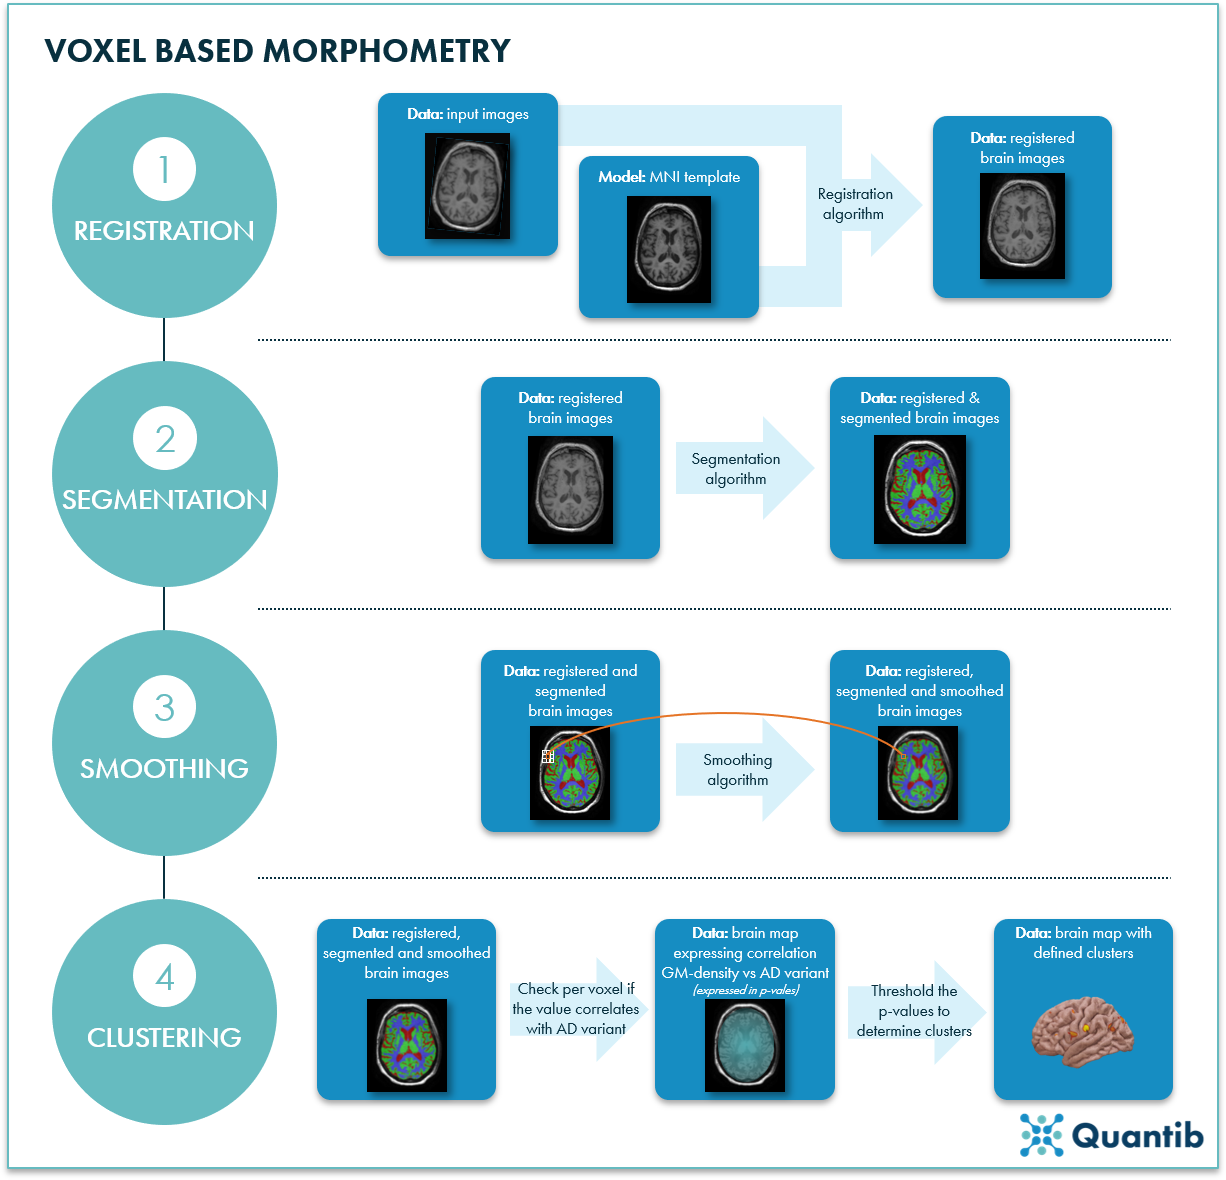
Figure 1: Voxel based morphometry of MRI brain scans can be done in 4 steps. 1) Registration. A registration algorithm compares an image to the MNI template, then transforms the input image to align it with the atlas. 2) Segmentation. A segmentation algorithm determines which pixels are white matter, gray matter, or cerebrospinal fluid. 3) Smoothing. For each voxel (orange box) in the image, you take the average of the surrounding voxels (white boxes) to assure each voxel contains information about its neighbors. 4) Clustering. Clusters are determined using linear regression to correlate grey matter density (GM-density) with AD variants and thresholding the voxel values.

Combining MRI brain scan information at voxel level with gene expression profiles
Now that we have a dataset that consists of a set of defined clusters covering specific brain areas, we can start connecting these areas to gene expression of AD associated genes.
Roshchupkin used the Allen Human Brain Atlas to do so. This atlas contains samples from around 500 locations (per subject, per hemisphere) collected from 6 brains post-mortem. For this specific research, 3 subjects were selected, and for each subject, 19 carefully selected loci were studied, and gene expression profiles were determined. The selected loci are associated with a high risk of AD.
Finally, the clusters resulting from the VBM analysis are linked to the gene expression profiles using the template coordinates, creating the final connection: image information at voxel level is linked with local gene expression. Because Roshchupkin focused on specific AD related loci, we can now gain insights into how specific AD related gene expression manifests itself on MRI images.
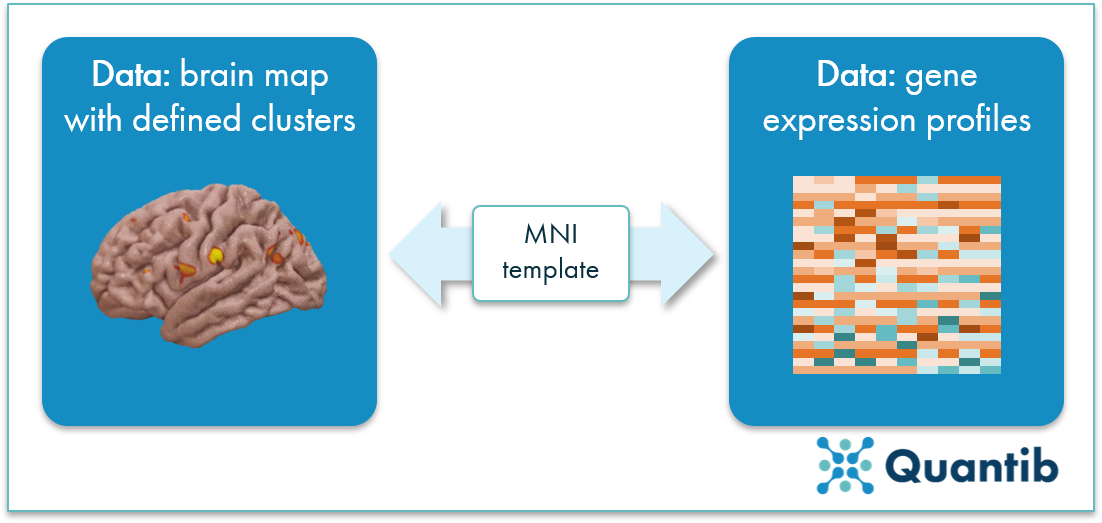
Figure 2: Voxel clusters are linked to gene expressions based on the MNI template to determine which areas in the brain are related to AD associated loci.
So what did Roshchupkin’s research prove?
Roshchupkin found indications for connections between grey matter density of certain brain regions and gene expression profiles in the regions of AD risk loci. Specifically, differences in gray matter density in the left postcentral gyrus, right superior frontal gyrus, and the right postcentral gyrus were shown to be associated with local AD gene expression patterns.2
Curious to learn more about artificial intelligence solutions to support imaging analysis in clinical dementia diagnosis workflows? Read more about our atrophy quantification and white matter hyperintensity detection software Quantib® ND Plus.

Bibliography
- Good, C. D. et al. A voxel-based morphometric study of ageing in 465 normal adult human brains. Neuroimage 14, 21–36 (2001).
- Roshchupkin, G. V. et al. Fine-mapping the effects of Alzheimer’s disease risk loci on brain morphology. Neurobiol. Aging 48, 204–211 (2016).