Different subtypes of dementia exist, with the most common form, which occurs in 50-70% of the cases, being Alzheimer’s Disease (AD). AD is associated with hippocampal, temporal, and parietal atrophy, which can be visualized in MR brain scans. Another subtype of dementia is Frontal Temporal Lobe Dementia (FTLD), with main areas of atrophy presented in the frontal lobe, temporal lobe, and hippocampus. These different types of dementia have very different prognosis as well as treatment. AD has an average lifetime expectancy of 8-10 years after diagnosis, where FTLD shows a much wider spread of 2-20 years. Early diagnosis of the subtype of dementia is, therefore, very relevant.
Establishing atrophy patterns from brain MRI in early stages of dementia is non-trivial. To reliably determine atrophy associated with dementia, you would preferably use longitudinal studies with a sufficiently long interval between scans. In clinical practice, however, you would like to make an accurate diagnosis at the time of the first scan. As a result, differentiating between types of dementia in clinical practice is a challenge. Quantification of atrophy of different brain structures would be of great help, but is a very time consuming activity without tools.

Advancements in the field of AI-enabled MR brain image analysis can support radiologists in arriving at more accurate diagnoses faster and with less effort. In this way, patients will have clarity much earlier in the process, the family can have an early start preparing for the situation to come, and treatment can be optimized.
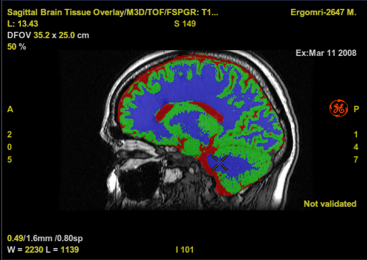
At Quantib BV, a spinoff from Erasmus MC, University Medical Center Rotterdam, we take a leading position in the challenge of providing radiologists with more information in less time using AI. Our current artificial intelligence based neurodegeneration products automatically segment and quantify brain structures, as well as return values for volumes of grey matter, white matter, and cerebrospinal fluid. User friendly visualization tools show the tissues and the CSF in different colors, overlaid on the T1-weighted scan. In addition, white matter hyperintensities are quantified both in number and in volume, and, after processing, can be reviewed and validated by the physician.
Curious to learn more about Quantib® ND, our brain volumetry and white matter hyperintensity tracking tool? Check out the Quantib® ND web page.