Both normal aging and neurodegenerative diseases, such as Alzheimer’s disease (AD), cause morphological changes of the brain due to neurodegeneration. As neurodegeneration caused by disease may be difficult to distinguish from that of normal aging, interpretation of magnetic resonance (MR) brain images in the context of diagnosis of neurodegenerative diseases is challenging, especially in the early stages of the disease.
Advanced, quantitative analysis of brain MR images can facilitate the differentiation between normal and abnormal neurodegeneration. In this blogpost, we discuss a spatio-temporal model illustrating morphological differences in the brain due to normal aging. This tool can aid clinical decision making and can possibly improve the diagnosis of neurodegenerative diseases.
A tool to measure brain morphology and the aging brain
Most clinically available tools for measuring changes in the brain are focused on providing volumetric information, i.e. the volume of specific brain structures is calculated. Wyke Huizinga developed a spatio-temporal model during her PhD research that provides a measuring instrument to quantify the changing shape of the aging brain and compare it to the average brain shape of a cross section of the population.
The morphology score for the aging brain
To quantify the shape of the aging brain, Huizinga uses a morphology score. This score indicates the position of a person’s brain shape in the aging pattern. The higher the morphology score, the more atrophy due to aging this person’s brain shows. The aging pattern includes a shrinking brain globally, increasing ventricle size, and decreasing cortex volumes.
Brain morphology variation within a population
The morphology scores are also used to quantify the variation within a reference population as a function of age. The result is a graph such as the one shown in figure 1. Age is shown on the x-axis, and the morphology score on the y-axis. With this tool, the morphology score of a new subject can be compared to that of the reference population, i.e. the user can gain insight on how the new subject’s brain shape compares to that of the reference population.
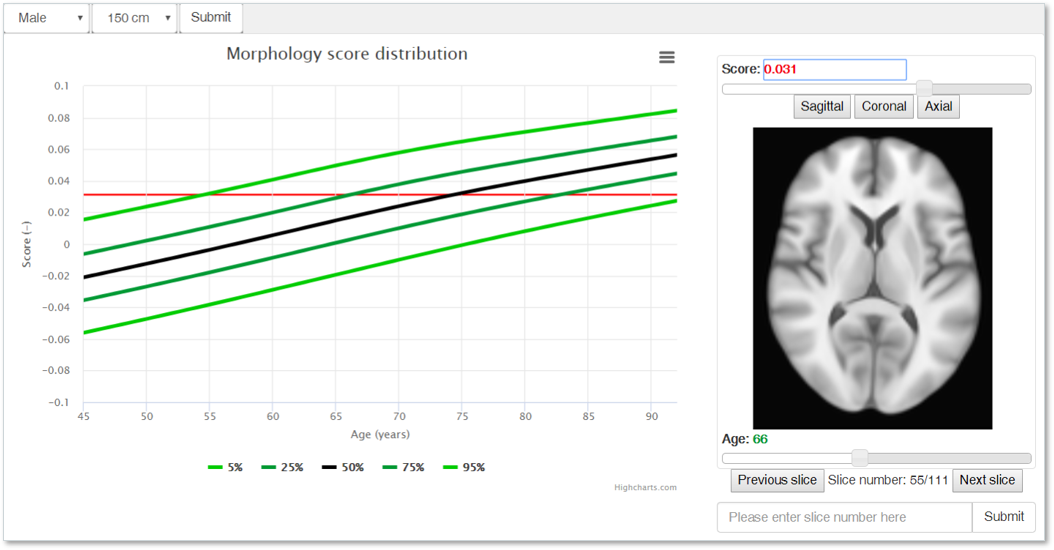
Figure 1: The spatio-temporal reference model of the aging brain as developed by Wyke Huizinga. Available at agingbrain.nl.
Comparing cognitive normals with demented subjects
Additionally, Huizinga compared the morphology of Alzheimer’s Disease (AD) subjects with different ages to those of cognitive normals. The resulting models indicate that AD manifests partially as accelerated aging. The spatio-temporal model from Huizinga presents itself as a tool to detect accelerated aging, hence, it potentially offers support for diagnosis of AD.
The brain morphology tool for the aging brain was developed in 3 steps
Based on 988 scans of non-demented, asymptomatic subjects from the Rotterdam Scan Study, Huizinga developed the aging brain tool in three steps.
Step 1: Create “the average brain” and calculate the morphology scores
A method called non-rigid, group-wise registration was used to map all input brain scans (the training set) to a common domain. This operation will create an “average brain” with “average morphology”. The benefit of using group-wise registration for this process lies in the fact that it takes all images in the training set into account equally, thereby making sure that the end result is not biased towards one of the input brain scans.
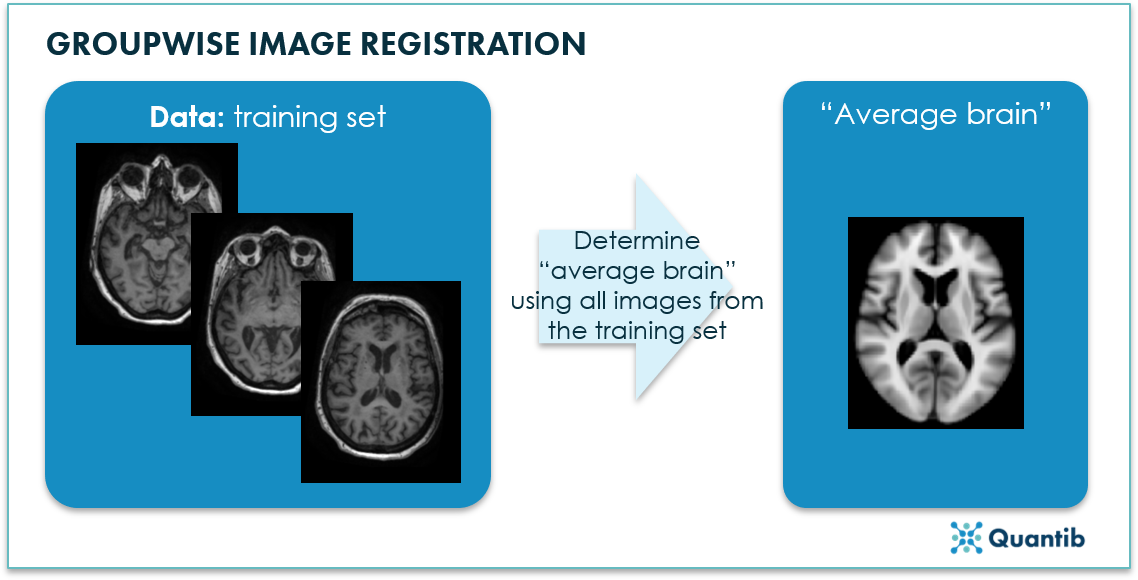
Figure 2: Based on all images in the training set, an “average brain” is calculated using group-wise image registration. Automatically, you also determine the difference between each image in the training set and the average brain.
Step 2: Correlate the morphology deformations of the aging brain
Step 1 provides information for each scan in the training set on how its shape differs from the average brain shape. In step 2, Huizinga used partial least squares regression to correlate these differences with age. This method removes all influences that are not related to age and ensures the resulting differences are only based on age. This technique provides two things: 1) the so-called morphology score - assigning each morphology a score, and 2) the aging pattern of the brain morphology - describing brain deformation patterns that are highly correlated with normal aging.
Step 3: Determine the percentile curves for the aging brain
In step 3, 988 morphology scores were obtained from the images of the training set. The calculated scores can be plotted as a function of age and the morphology score variation in the population can be quantified using percentile curves. These curves tell us which morphology score is to be expected at a certain age, with a certain probability. In other words, percentile curves will help the user estimate how likely the morphology score of a new subject is, while taking statistical variance into account.
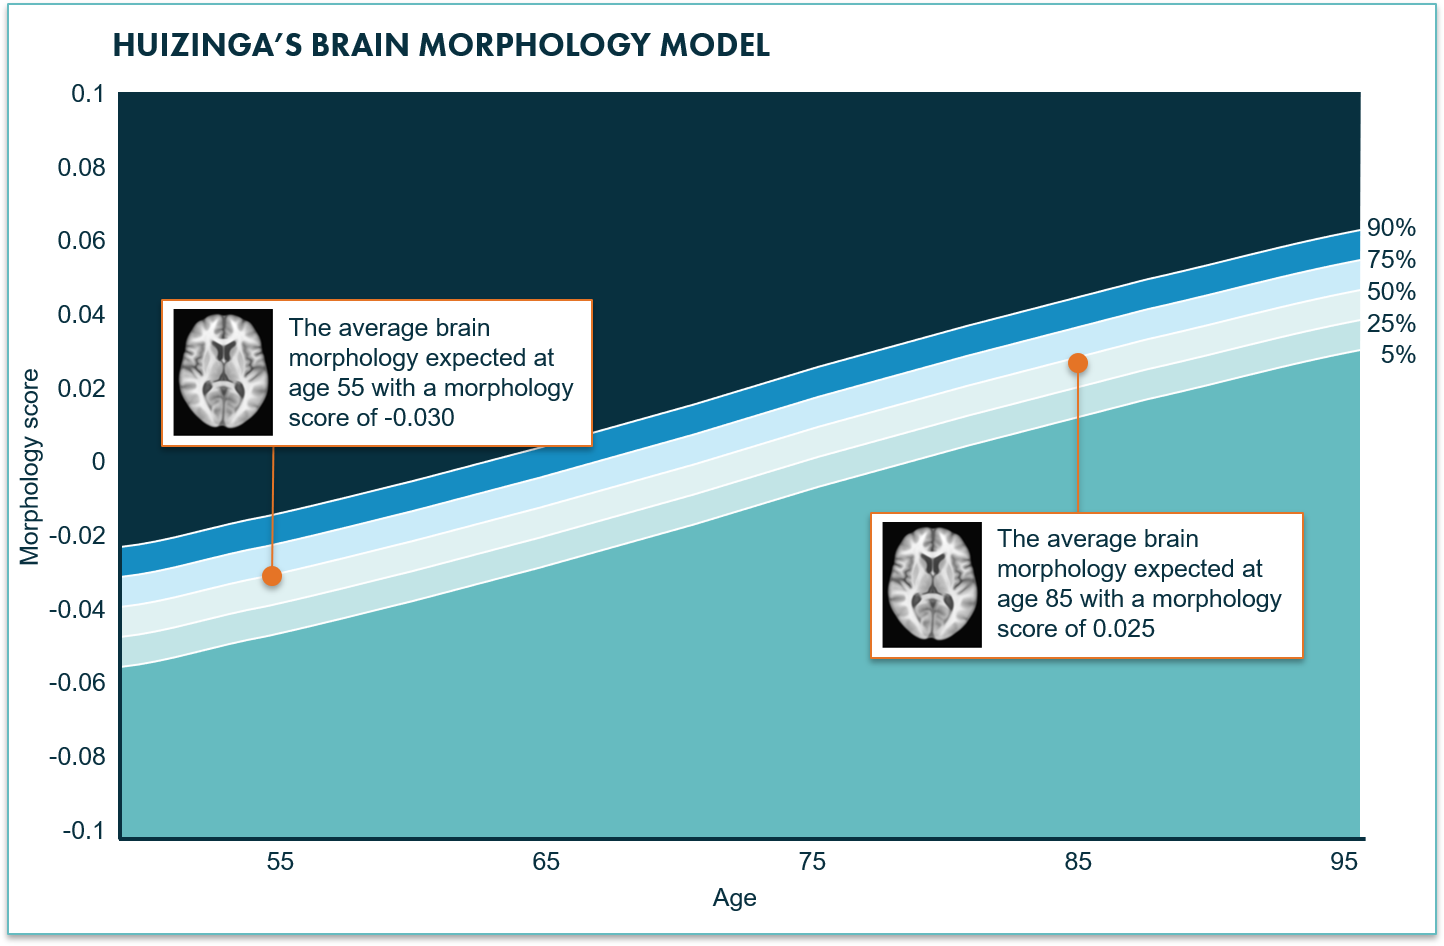
Figure 3: A schematic example of the morphology scores distribution as a function of age including confidence intervals for 95%, 75%, 50%, 25%, and 5%.
The aging brain morphology tool versus Quantib’s reference centile curves
Huizinga’s brain morphology model shows some similarities and some differences from the Quantib reference centile curves (RCCs), as provided in Quantib® ND Plus.
The Quantib RCCs, as shown in figure 4, provide a normative distribution of brain volumes. The distribution can be accessed for different brain structures, including lobes and hippocampus. Huizinga’s tool uses one number, the morphology score, to represent the shape of the whole brain.
The tool captures all shape-related information on the whole brain in one graph, providing a fast overview of information. The Quantib RCCs provide only volume-based information. However, the user can compare volumes for different brain structures. Indirectly, this provides information on the brain shape as well. This might even give the user a better grasp of what changes in which brain areas are leading to a certain change in brain shape.
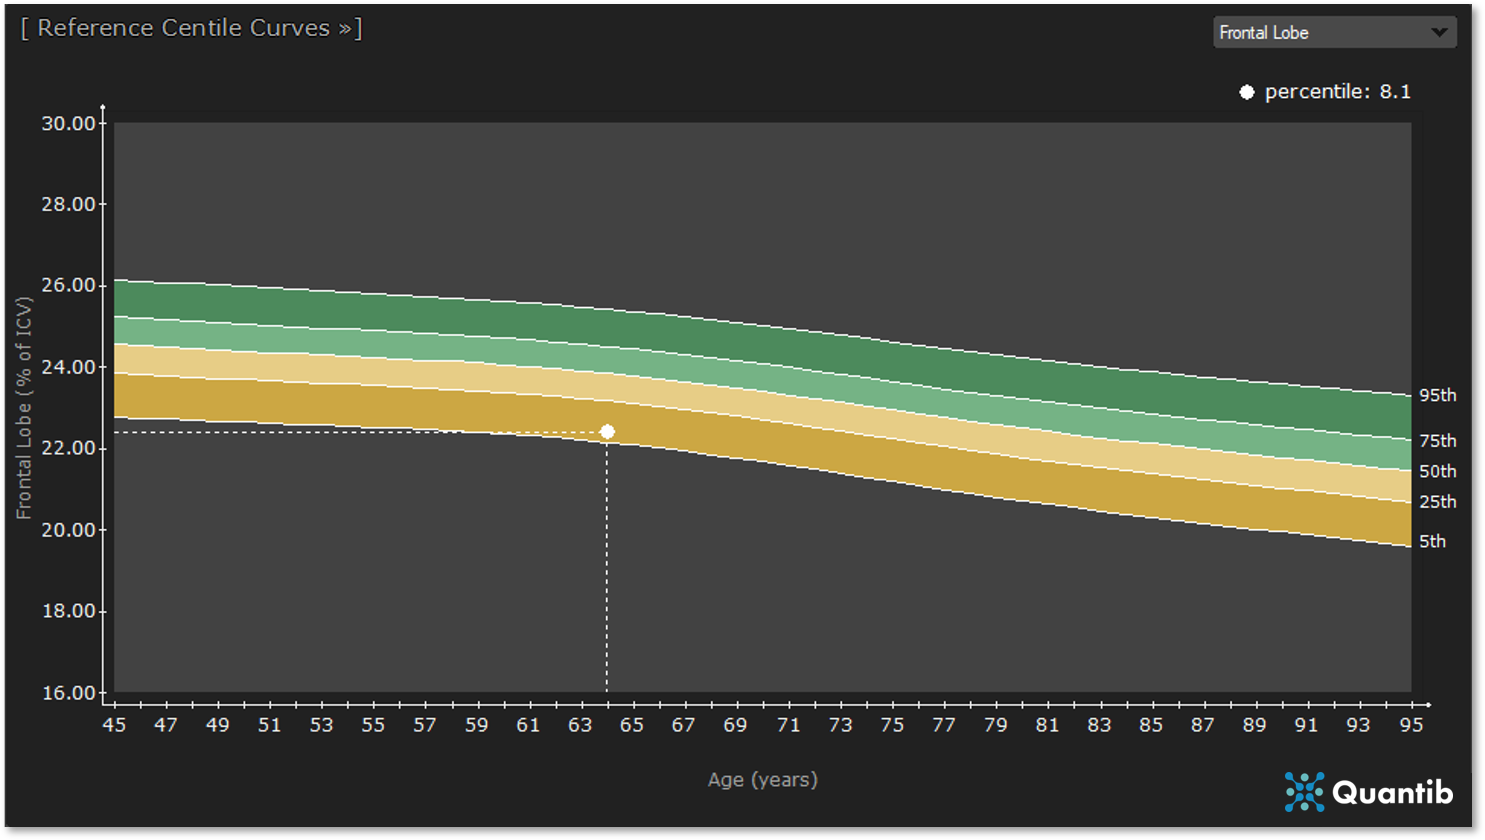
Figure 4: Quantib ND’s RCCs provide reference data for brain volumes as a function of age. The curves can be accessed for total brain volume, lobes, and hippocampus. The example in this graph shows the RCCs for the frontal lobe, also accessible for the left and right lobe separately in Quantib® ND Plus.
Interestingly, both models are based on data from the Rotterdam Scan Study. Quantib’s RCCs used a dataset of almost 5000 subjects to construct the curves, whereas Huizinga’s tool was calculated using almost 1000 T1w scans. However, to obtain a thorough understanding of how both tools serve in a clinical setting and how their performance compares, comparative research should be performed.
So how could a radiologist use the aging brain morphology tool in practice?
Using quantified information about the aging brain for dementia diagnosis is becoming more common. Several ways of providing this data are available. The spatio-temporal reference model as developed by Huizinga is one example, the Quantib’s RCCs are another. The user should always bear in mind that, for clinical use, regulatory approval is mandatory.
The spatio-temporal model for the aging brain is available at agingbrain.nl.
Curious to learn more about Quantib products that offer reference centile curves to compare patient brain volume to a cross-section of the population? Learn more about Quantib® ND Plus!
