Radiology is a great profession. The ability to answer clinical questions with great certainty using imaging is a highly fulfilling opportunity to help patients. In fact, it is hard to imagine modern medicine without cross-sectional imaging techniques, such as ultrasonography, CT, MRI or nuclear medicine. Imaging can be used for triage, diagnosis, disease staging, prognosis and can guide highly precise invasive and non-invasive treatment. Because it is so broadly useful, it is considered one of the greatest medical advances of the past 1000 years1.
When I started my radiology training, I quickly learned that interpreting examinations is great fun. You are presented with a clinical problem or question and search for relevant changes in anatomy or function. The relevant abnormalities are described in a concise report for the referring clinician who can then use this information to formulate a treatment plan.
Conversely, a normal study can reassure patients that they most likely do not have a serious condition. What I also quickly learned is to disregard irrelevant findings. Clinicians don’t want to be inundated with descriptions of non-urgent findings that are of no relevance to the question at hand. Learning how to write a good radiology report takes considerable time and effort and is a skill honed over many years.
The need for quantitative radiology
Nevertheless, as a practicing radiologist I often wish I had time to get more out of my images. Let me illustrate this with some examples. When I read a CT or MRI scan of the brain, I often encounter patients with deep brain white matter abnormalities. It is common practice to describe these, and to grade the extent using the Fazekas scale (figure 1). This scale is a very rough scheme designed to quickly categorize patients. I lost count of how often clinicians asked me: “Don’t you have a technique to quantify these abnormalities more precisely?”.
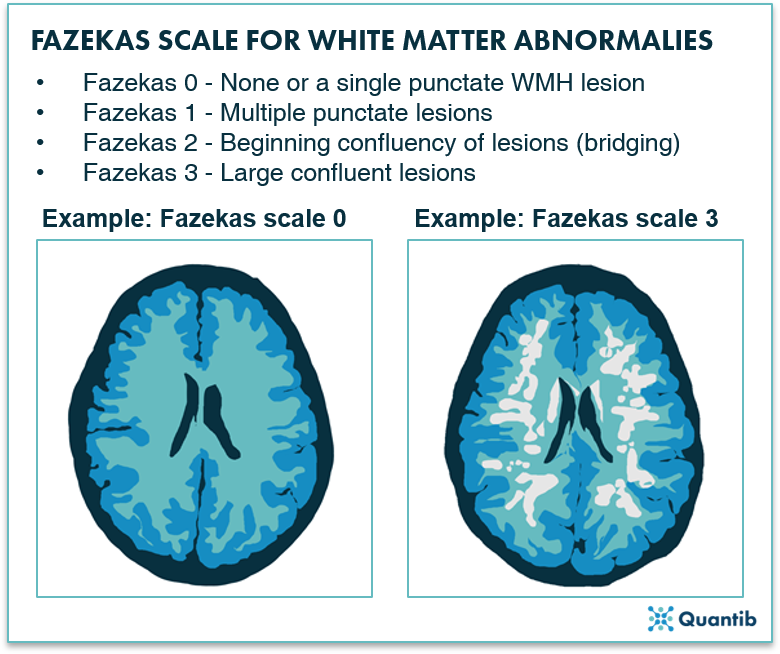
Figure 1: Fazekas Scale for MRI brain images ranging from 0 to 3 indicating less and more severe WMH lesions, respectively2.
The same goes for changes in brain volume when patients get older. We often see that the amount of brain tissue is decreasing, and we often mention this in our reports with vague descriptions such as: “there is beginning/some/generalized atrophy of the brain”, often followed with subjective statements such as: “normal for this age”.
When using such terminology, it is easy to understand that there can be substantial differences in interpretation between two radiologists when they read the same study or different studies over time in the same patient. More importantly, it is a missed opportunity to better understand the continuum between what is normal and where things start to become abnormal. From a patient perspective it is a missed chance to take action. This problem is not limited to brain imaging but applies in all body areas.
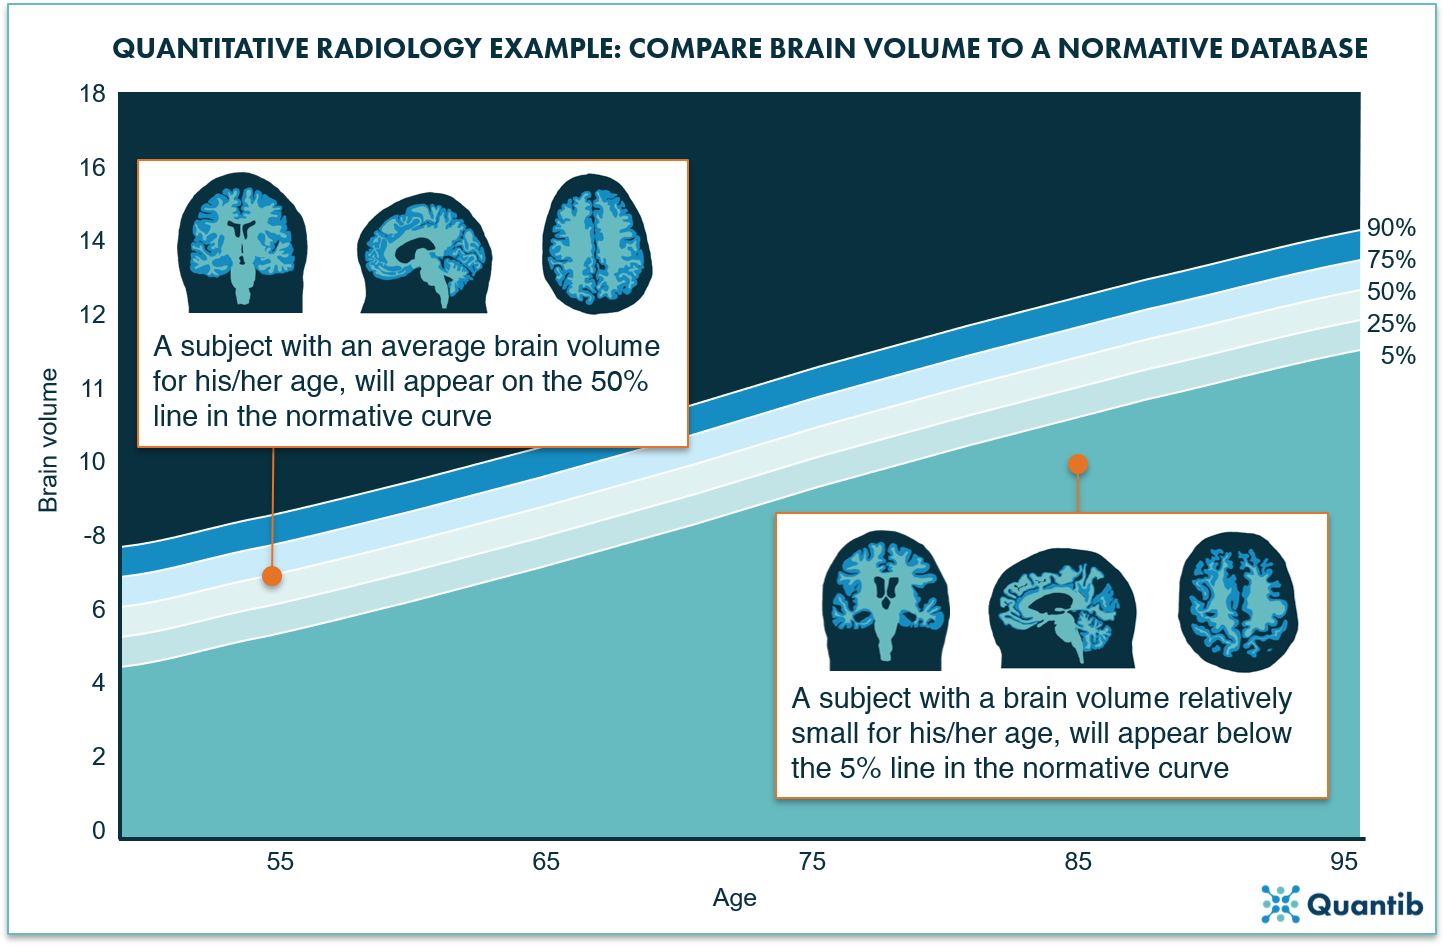
Figure 2: A normative curve can provide an age-based reference for volume measurements of different organs. For example, a graph determined based on a cohort of thousands of subjects, can provide information on the brain volume to expect for your patient at a certain age (and likewise, it gives a hint when the brain volume is significantly above or below that expected average volume).
I am a cardiovascular imager and I often read cardiac CT scans to look for abnormalities in the coronary arteries. While we have highly structured, validated systems for reporting abnormalities in the coronary arteries3, these systems often completely disregard any signs of atherosclerotic disease outside the heart. In a substantial number of patients, I see signs of atherosclerosis outside the heart but not in the coronary arteries. Unfortunately, there are presently no good tools to quantify these abnormalities and therefore we do not know very well how to deal with them in terms of treatment.
These examples concern the quantification of abnormalities relevant to the clinical question. Sometimes, however, we encounter abnormalities such as signs of atherosclerosis in scans made for entirely different purposes (e.g. a total body CT scan in a trauma patient). There is no clear guidance on how to deal with these incidental findings, especially if they are not urgent. There are many other examples to think of, but I’m sure you get the general idea.
The potential impact of quantitative radiology
So, how can we make radiology even better? How can we get more out of routine imaging studies? In my opinion, the answer lies in quantification.
Advances in artificial intelligence and machine learning are enabling highly detailed image analysis in a matter of seconds. Compare this to how we work in radiology today: highly skilled radiologists and technologists who manually measure a very limited set of metrics due to time restrictions.
I envision a future where cross sectional images are fed into a pipeline of AI algorithms that can precisely and reproducibly quantify a variety of anatomical structures, organ changes and signs of disease. Over time, highly precise hospital-specific databases can be generated with normal values for all organs and structures. Changes due to aging or the presence of disease can be quantified more precisely as can response to therapy. More precise quantification also helps to assess the effects of new drugs. This will be done not only using segmentation techniques, but also using quantitative analytics of grey scale pixel values, a technique also known as radiomics4. Radiomics can unmask clinically relevant differences in tissue structure that are correlated with gene-expression, tumor aggressiveness and a host of other relevant features5.
The output of these AI algorithms can be used to pre-populate a structured report that complements the interpretation by the radiologist. We need to carefully validate which metrics are relevant in which disease, but that is just a matter of time. Of course, AI will also be capable of assisting radiologists in interpreting studies. Algorithms can be used to guide human experts through an examination in a structured manner. Although this is not quantification per se, such algorithms would be highly useful especially for those with less experience.
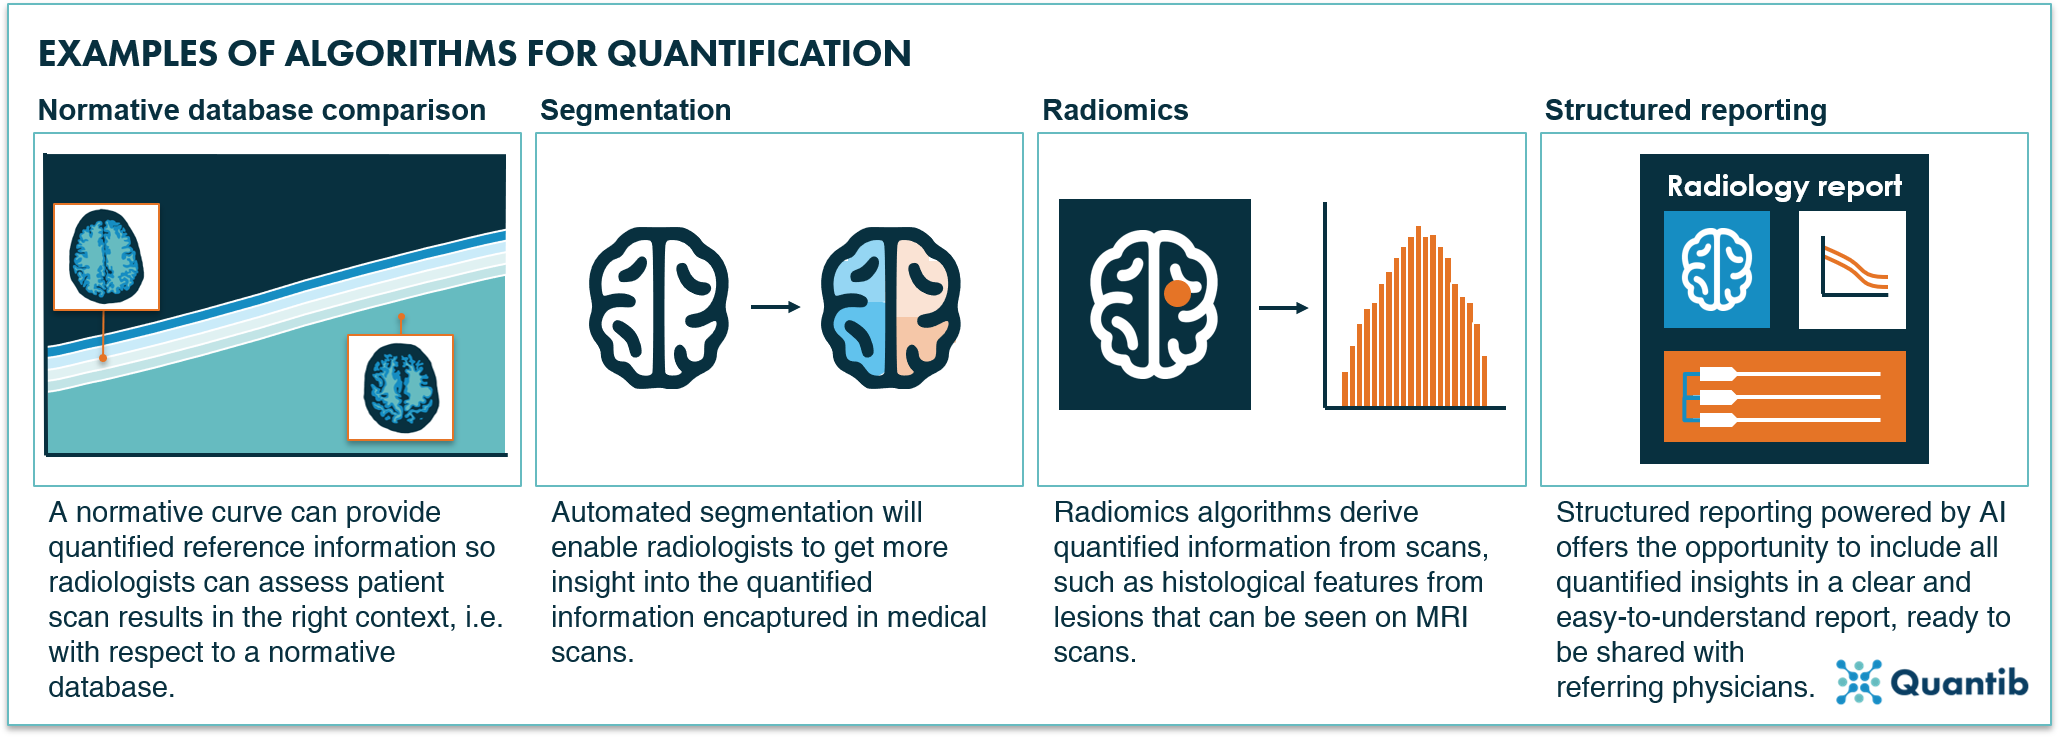
Figure 3: Four examples of AI algorithms for quantification in radiology: normative database comparison, segmentation, radiomics and structured reporting.
In conclusion
We are now entering the era of quantitative radiology. This is great for radiologists who will soon be capable of instantaneously extracting all the relevant information present in the imaging studies they are reading. It is even better news for patients since it allows for more precise individually tailored diagnosis, treatment planning and prevention.
Discover Quantib's FDA cleared and CE-marked AI-driven software for brain atrophy and WMH quantification.

Bibliography
- Looking back on the millennium in medicine. N Engl J Med 2000;342:42-49.
- Barkhof, F. Dementia - Role of MRI. (2007). Available at: https://radiologyassistant.nl/neuroradiology/dementia/role-of-mri#assessment-of-mr-in-dementia-fazekas-scale-for-wm-lesions.
- Cury R, Abbara S, Achenbach S, Agatston A, Berman DS, Budoff MJ et al. CAD-RADS Coronary Artery Disease Reporting and Data System. An expert consensus document of the Society of Cardiovascular Computed Tomography (SCCT), the American College of Radiology (ACR) and the North American Society for Cardiovascular Imaging (NASCI). Endorsed by the American College of Cardiology. J Cardiovasc Comput Tomogr 2016;10:269-281.
- Gillies RJ, Kinahan PE, Hricak H. Radiomics: Images Are More than Pictures, They Are Data. Radiology 2016;278:563-77.
- Rogers W, Thulasi Seetha S, Refaee TAG, Lieverse RIY, Granzier RWY, Ibrahim A, et al. Radiomics: from qualitative to quantitative imaging. Br J Radiol 2020;93:20190948.