 QUANTIB® ND
FDA cleared and CE marked solution for atrophy quantification and WMH detection
Brain atrophy analysis
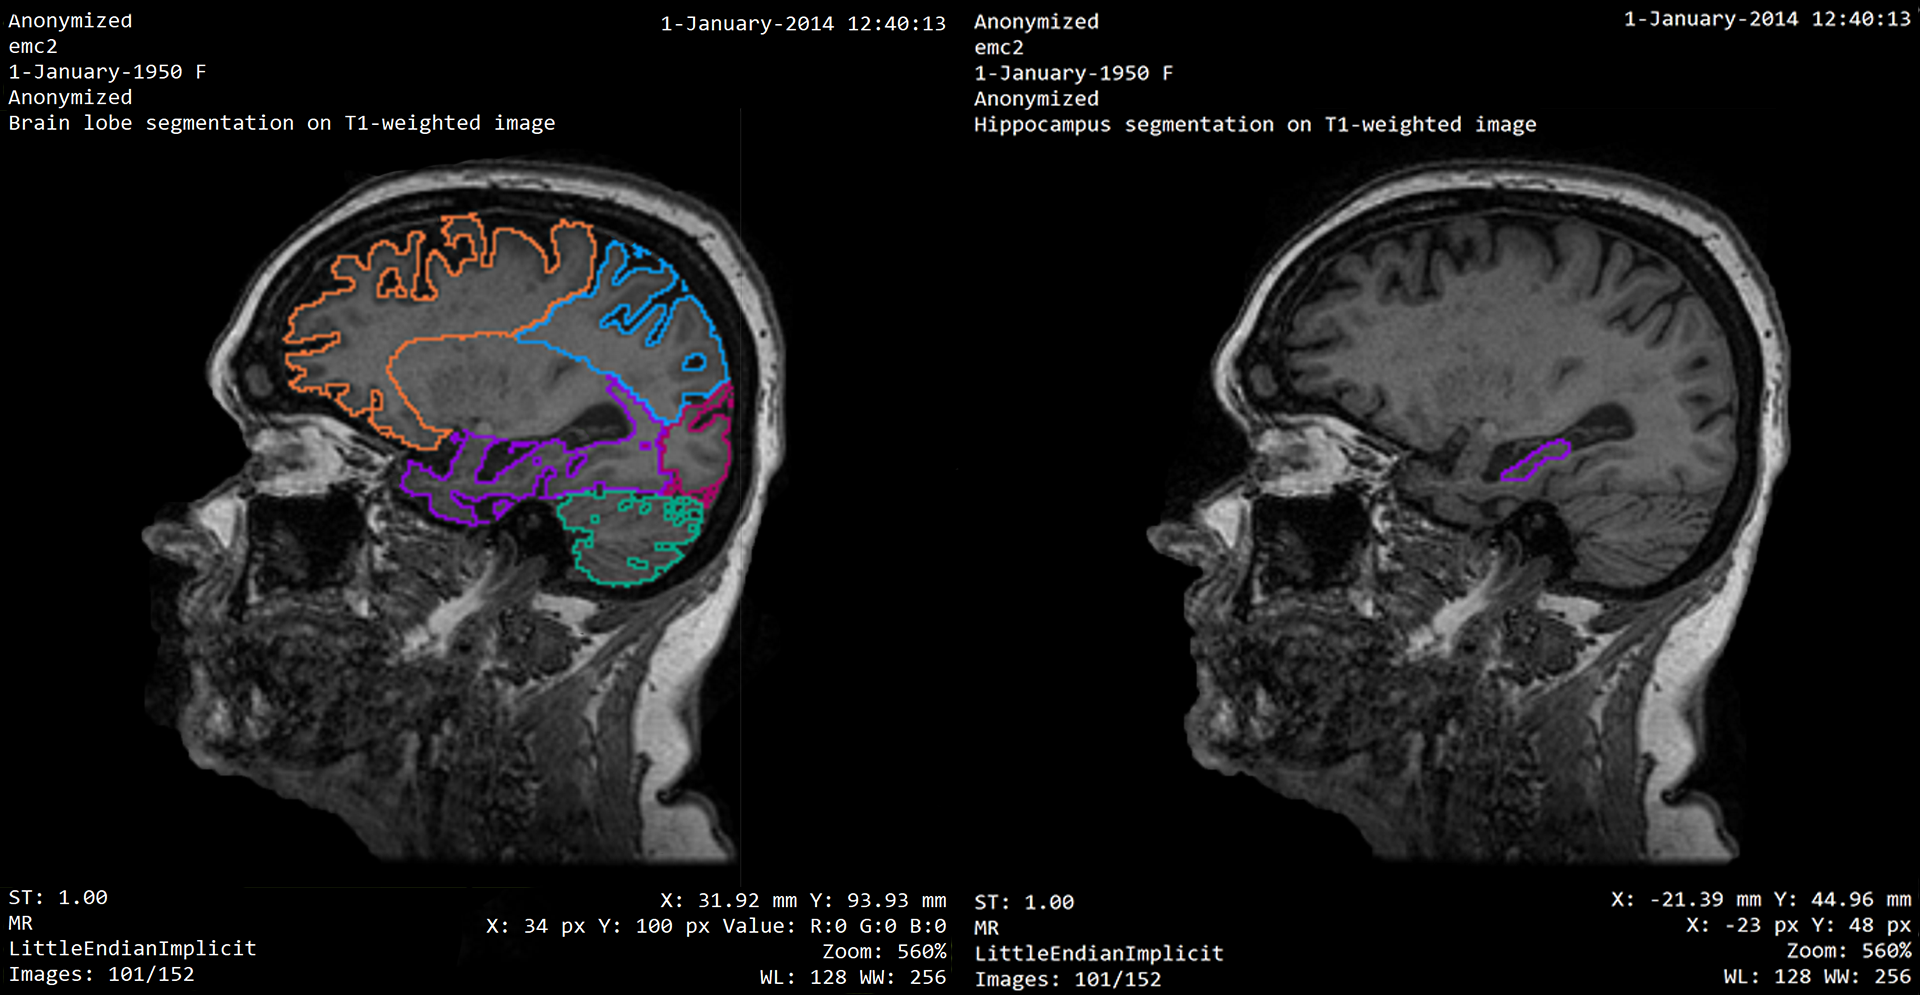
Quantib® ND supports radiologists assessing and monitoring brain atrophy by automatically segmenting and measuring brain structures upon scan receival. Once the results are ready, they will be exported to PACS. Neither the single-time-point nor the longitudinal analysis require user interaction.
Atrophy comprehensive reports
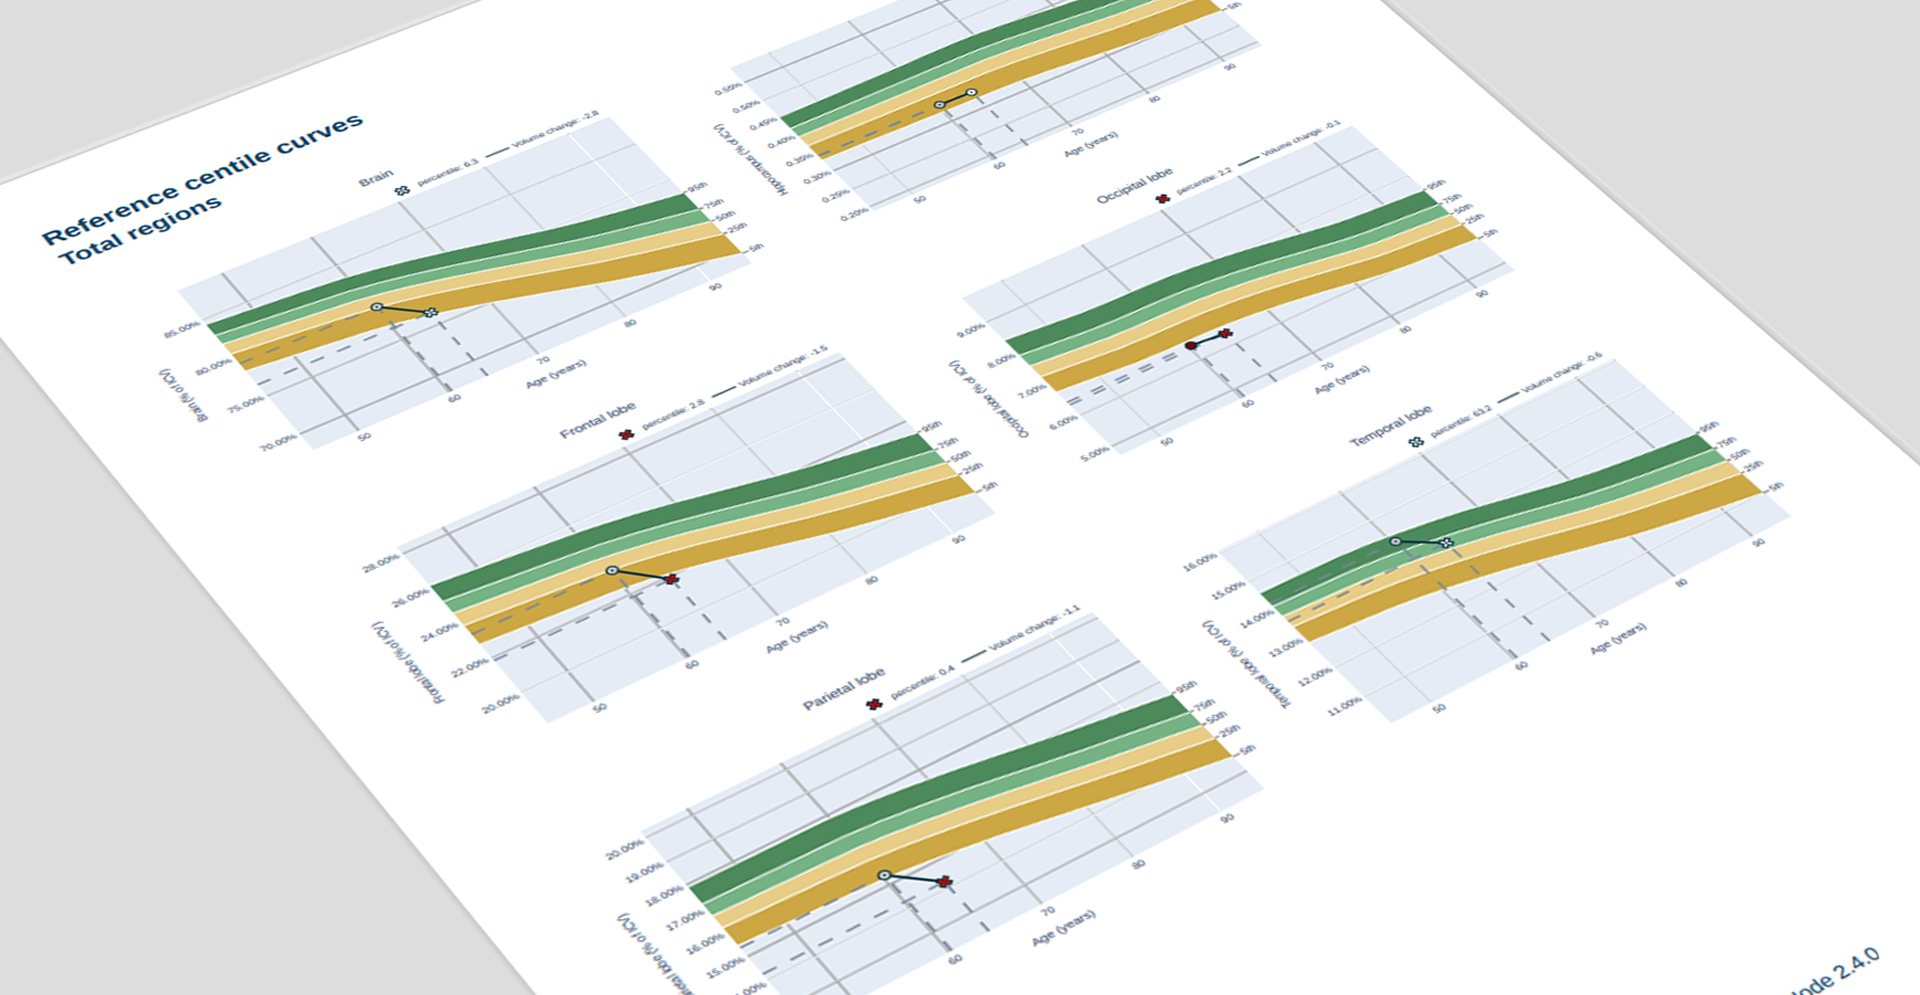
Atrophy can be assessed and monitored through two main features of the reports: a comprehensive table and reference centile curves. The table shows the volumes of all brain structures and the reference centile curves per brain structure allow the comparison of patient brain volume development to the mean values for a non-demented population.
WMH analysis
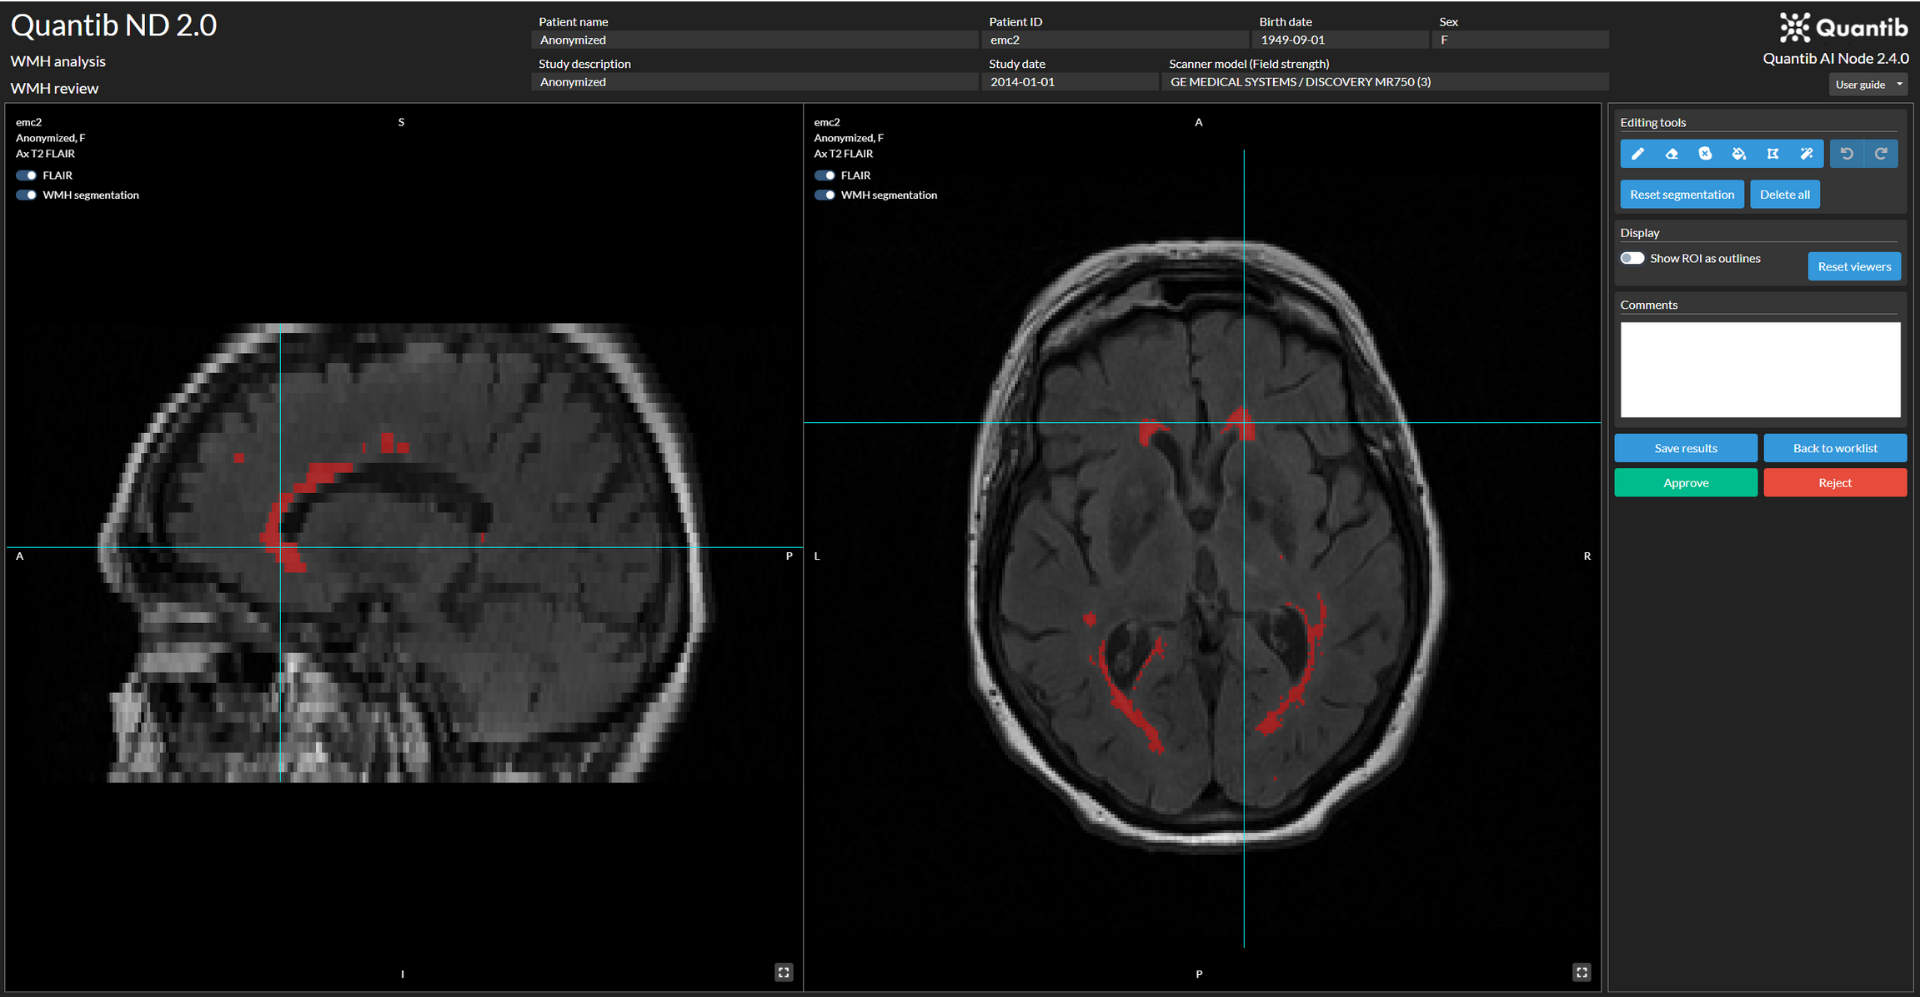
Quantib® ND offers single-time-point and longitudinal white matter hyperintensities analyses to support single examinations and tracking of lesion development.
The single-time-point automatic WMH segmentation can be corrected if needed. The londitudinal analysis computates volume changes automatically.

Using Quantib® ND enables us to provide our clinicians with valuable objective information derived from our MRI scans. Comparing the patient's results to a non-biased reference population makes it easier for clinicians to give patients insights into their atrophy development.
Mario Muto | Director Diagnostic and Interventional Neuroradiology unit at Cardarelli Hospital, Naples
.png?width=166&height=166&name=Meike%20Vernooij%20(b%26w).png) During our MDT meetings, we always pull up the report from Quantib® ND and use it as extra information to come to a joint decision on the best diagnosis and clinical management of the patient.
During our MDT meetings, we always pull up the report from Quantib® ND and use it as extra information to come to a joint decision on the best diagnosis and clinical management of the patient.
Meike Vernooij | Professor of Population Imaging at Erasmus MC, Rotterdam
Curious for more detailed information on Quantib® ND?
![]()